Building a Basic Financial Model
By mastering basic financial modelling, product managers can make more informed decisions and communicate value more effectively to stakeholders.
Financial modelling is an essential skill for product managers who want to understand and communicate the economic impact of their decisions. While you may not need the depth of expertise that finance professionals have, knowing how to build a basic profit and loss (P&L) statement will help you make better product decisions, communicate more effectively with stakeholders, and demonstrate the business value of your initiatives.
Why Financial Models Matter for Product Managers
Here's why it matters:
- You'll be able to make more informed prioritisation decisions by understanding the financial implications
- You can build stronger business cases for your product initiatives
- You'll communicate more effectively with executives and finance teams
- You'll better understand how your product contributes to the company's overall financial health
The Foundation: Understanding the P&L Statement
The P&L shows how your product or business generates revenue and incurs costs over a specific period. It answers the fundamental question: "Is our product profitable, and if not, why not?"
A P&L statement typically follows this structure:
- Revenue - Cost of Goods Sold (COGS) = Gross Profit
- Gross Profit - Operating Expenses = Operating Income
- Operating Income - Taxes and Interest = Net Profit
1. Revenue
Revenue represents the money your product brings in from customers. For product managers, it's important to break revenue down to understand its drivers:
- Units Sold: How many units or subscriptions are you selling?
- Price: What is the average price per unit or subscription?
- Revenue = Units × Price
You might also need to segment revenue by:
- Product lines
- Customer segments
- Geographic regions
- Subscription tiers
2. Cost of Goods Sold (COGS)
COGS represents the direct costs associated with producing and delivering your product.
For software products, these might include:
- Server and hosting costs
- Third-party API fees
- Customer support directly tied to product usage
- Payment processing fees
For physical products, COGS typically includes:
- Raw materials
- Manufacturing costs
- Packaging
- Shipping
COGS are generally variable costs that scale with the number of units sold or customers served.
3. Gross Profit and Gross Margin
Gross profit is simply Revenue - COGS
Gross margin is a critical metric for product managers, as it shows how much money is left after covering the direct costs of your product. This remaining amount must cover all your other expenses and ultimately generate profit.
4. Operating Expenses
Operating expenses (often called OpEx) include all other costs of running the product that aren't directly tied to producing each unit. These typically include:
- Research and Development (R&D): Engineering, product management, design
- Sales and Marketing: Sales teams, advertising, promotions, content marketing
- General and Administrative (G&A): Management, finance, HR, office space
Operating expenses are often more fixed in nature, meaning they don't necessarily scale directly with each unit sold.
5. Operating Income
Operating income (sometimes called EBIT - Earnings Before Interest and Taxes) shows the profit generated by your core product operations:
This is a crucial number for product managers, as it represents the true profitability of your product before accounting for company-wide financial factors like interest and taxes.
Building Your First P&L Model: A Step-by-Step Approach
Now let's build a basic P&L model for a hypothetical SaaS product using a spreadsheet. We'll create a monthly model that forecasts one year ahead.
Step 1: Set Up Your Spreadsheet Structure
First, create a spreadsheet with months across the top as columns (January through December) and line items down the left as rows. Include a column for annual totals on the right.
Step 2: Model Your Revenue
Start by modelling the key drivers of revenue:
- Customer Acquisition: How many new customers will you acquire each month?
- Customer Retention: What percentage of existing customers will remain each month?
- Pricing: What is your monthly price per customer?
For example:
- New customers per month: Start with 100 in January, growing by 10% monthly
- Monthly churn rate: 5% (meaning 95% of customers stay each month)
- Monthly subscription price: $50 per customer
Your spreadsheet might look like this:
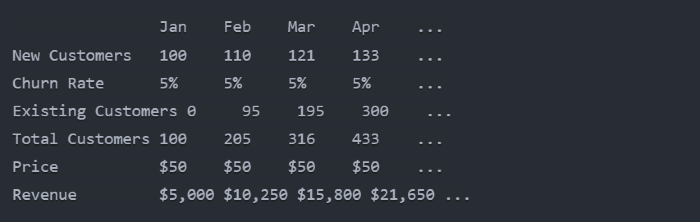
Notice that each month, the "Existing Customers" equals the previous month's Total Customers × (1 - Churn Rate).
Step 3: Model Your COGS
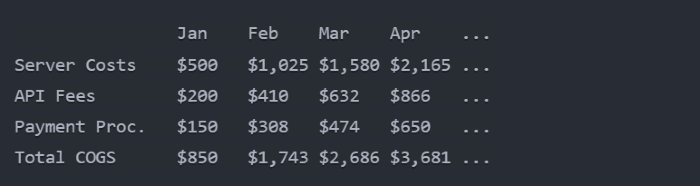
Next, identify your direct costs per customer. For a SaaS product, these might include:
- Server costs: $5 per customer per month
- Third-party API fees: $2 per customer per month
- Payment processing: 3% of revenue
Your COGS section might look like this:
Step 4: Model Your Operating Expenses
Now, model your operating expenses, which typically include:
- R&D: Engineering and product team costs
- Sales & Marketing: Customer acquisition costs and marketing expenses
- G&A: Overhead expenses
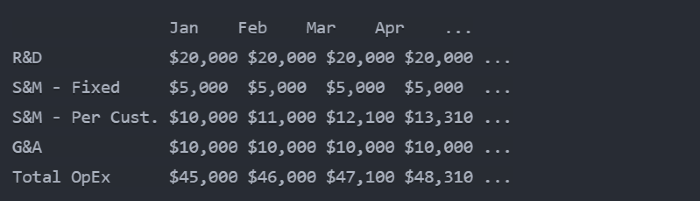
For example:
- R&D: $20,000 per month (assuming a fixed team size)
- Sales & Marketing: $100 acquisition cost per new customer, plus $5,000 fixed marketing expenses
- G&A: $10,000 per month
Your OpEx section might look like this:
Step 5: Calculate Operating Income
Finally, calculate your operating income:

Notice that our hypothetical product is losing money in the early months, which is common for growing products with significant fixed costs. The key question becomes: when does the product become profitable?
Key Financial Metrics for Product Managers
Beyond the basic P&L structure, several financial metrics are particularly important for product managers:
1. Customer Lifetime Value (LTV)
LTV represents the total gross profit a customer generates over their lifetime with your product. For subscription products with a constant churn rate:
For example, if your monthly gross profit per customer is $40 and your monthly churn rate is 5%, then your CLTV is $800 (40 ÷ 0.05 = $800)
2. Customer Acquisition Cost (CAC)
CAC represents how much you spend, on average, to acquire a new customer:
For example, if you spent $15,000 on acquisition in a month and acquired 100 customers, then you have a CAC of $150 (15,000 ÷ 100 = $150)
3. LTV : CAC Ratio
The LTV ratio helps determine if your customer economics are sustainable:
A healthy SaaS business typically has an LTV : CAC ratio of at least 3:1, meaning the lifetime value of a customer is at least three times the cost to acquire them.
4. Payback Period
The payback period tells you how long it takes to recoup your customer acquisition cost
For example, if your CAC is $150 and your monthly gross profit per customer is $40, then your payback period is 3.75 months.
A typical target is a payback period of 12 months or less.
Scenario Analysis: Making Your Model Useful
A financial model becomes truly valuable when you use it to analyze different scenarios. Here are some scenarios product managers often need to evaluate:
1. Pricing Changes
Model what happens if you:
- Increase price by 20%
- Decrease price by 10%
- Introduce a new pricing tier
For each scenario, estimate the impact on:
- Customer acquisition
- Customer retention
- Overall revenue and profitability
2. Feature Investments
Model the financial impact of investing in new features:
- Development costs (time and resources)
- Expected impact on acquisition and retention
- Potential new revenue streams
3. Marketing Investments
Model what happens if you:
- Double your marketing budget
- Cut marketing spend by 30%
- Shift spending between channels
For each scenario, estimate the impact on:
- Customer acquisition
- CAC
- Time to profitability
Presenting Financial Models to Stakeholders
When presenting your financial model to stakeholders, focus on:
- Key Assumptions: Clearly state the assumptions underpinning your model
- Sensitivity Analysis: Show how changes in key variables affect outcomes
- Strategic Implications: Explain what the numbers mean for product decisions
- Risks and Mitigations: Acknowledge uncertainties and how they could be addressed
Remember that a financial model is a tool for decision-making, not a perfect prediction of the future.
Common Pitfalls to Avoid
When building financial models, product managers often make these mistakes:
- Overly Optimistic Assumptions: Be realistic about growth rates, conversion rates, and churn
- Overlooking Hidden Costs: Account for all costs, including often-forgotten ones like customer support scaling
- Ignoring Seasonality: Many businesses have significant seasonal variations
- Fixed vs. Variable Confusion: Be clear about which costs scale with customers and which don't
- Insufficient Validation: Test your assumptions against historical data or industry benchmarks
Collaborating with Finance Teams
Building a financial model isn't something you should do in isolation. Your finance team can be an invaluable partner:
- Seek Input Early: Get finance involved in validating your approach and assumptions
- Learn Company Standards: Understand how financial models are typically structured in your organization
- Validate Your Model: Have finance review your model before presenting to other stakeholders
- Understand the Bigger Picture: Learn how your product's economics fit into the company's overall financial structure
Conclusion: Financial Modelling as a Product Management Superpower
Financial modelling is a powerful skill that can elevate your effectiveness as a product manager. By understanding the economic engine of your product, you can:
- Make more informed prioritization decisions
- Build compelling business cases for your initiatives
- Communicate more effectively with executive stakeholders
- Understand the true impact of your product decisions
Start with a simple model focused on the key drivers of your business, refine it over time with input from finance and other stakeholders, and use it as a tool to guide better decision-making. Remember that the goal isn't perfect prediction, but rather a deeper understanding of your product's economic dynamics.
By embracing financial modelling, you'll develop a more holistic perspective on product management that combines user-centred design with business-minded decision-making—a combination that can truly set you apart as a product leader.